SEV322 Hydraulic Design and Flow Analysis of a Multi-Reach Irrigation Channel System
SEV322 HYDRAULIC DESIGN AND FLOW ANALYSIS OF A MULTI-REACH IRRIGATION CHANNEL SYSTEM USING OPEN CHANNEL FLOW PRINCIPLES
1. Introduction
This paper includes the hydraulic analysis and design assessment of open channel irrigation system for Crab River Irrigation Trust. There are many channel reaches of diverse dimensions, gradient and natural materials for which assessment of the flow characteristics under normal and storm conditions have been determined. Some of the main goals are to define settings of the sluice gates, to calculate the maximum possible capacity of the channel, to classify the flow surface profiles, and to design the critical-depth flow meter. Expert values such as Manning’s equation, ideas of energy, gradually varied flow, and the direct step method are used. The results will be beneficial for achieving safe delivery of water in the intended network and also with the least wastage and impediments as measured. Students looking for best assignment help can use this sample to understand how hydraulic principles are applied to irrigation channel design and flow analysis
2. Sluice Gate Flow Analysis (Q1)
This section discusses hydraulic characteristics of the sluice gate which is placed at the upstream part of the rectangular concrete channel. The goal is to find out the sluice gate opening necessary for attaining a designed flow rate of 3.0 m³/s under normality conditions together will be assessing the flood conditions behaviour (Bhattacharya and Solomatine, 2020). It is however, possible to analyze the possibility of a hydraulic jump downstream as well. The geometry is depicted in the figure Q1 as displayed in the assignment brief.
2.1 Determination of Gate Opening Height for Designed Flow (Q1.(i))
Given Data
- Channel width (b) = 1.8 m
- Normal upstream water depth (y₁) = 2.0 m
- Energy loss at the gate = 10% of velocity head downstream
- Discharge (Q) = 3.0 m³/s
- Gravity (g) = 9.81 m/s²
Neglecting losses through friction over the short reach, from application of Bernoulli’s energy equation with losses between the free surface upstream (point 1) and just subcritical depth under the sluice gate (point 3) is as follows.
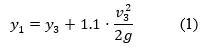
Where is the sluice gate opening, and is the velocity just under the gate:

Substituting Equation (2) into Equation (1):

This problem was solved numerically, more specifically it was solved by trial-and-Error method or iterative approximation. The value that holds true for this equation is:
Therefore, an average sluice gate opening of 1.76 meters shall be used for the design when the reservoir water level is normal to get flow rate of 3.0 m³/s.
2.2 Flow Parameters under Storm Condition (Q1. (ii))
For the storm conditions, flood supply channel sluice gate is maintained at a provisional dimension of , whereas the upstream head is elevated to . Now by applying the Bernoulli’s equation under the same energy loss condition as follows (Chen et al., 2021):
The flow area under the gate is:
Therefore, the actual discharge during the storm is:
Froude Number and Flow Regime
The Froude number (Fr) is calculated as:
Since , the flow is supercritical.
2.3 Hydraulic Jump Analysis and Associated Energy Loss
A hydraulic jump is defined as the phenomenon resulting from the change of flow from super critical to sub critical case and perhaps downstream of a sluice gate. The conjugate (sequent) depth is assess from the momentum equation for rectangular channels as follows:
Substituting values:
Energy Loss in the Jump
Energy loss () is estimated using:
This affirms that a hydraulic jump is evident and, therefore, energy loss of 1.19m occurs which acts as a measure to prevent the transfer of excess energies to the downstream structures.
Summary of Q1 Results:
| Parameter | Value | Unit |
|---|---|---|
| Required sluice gate opening for Q = 3.0 m³/s | 1.76 | m |
| Flow velocity during storm condition | 7.0 | m/s |
| Flow rate during storm (y₁ = 3.0 m, y₃ = 0.25 m) | 3.15 | m³/s |
| Froude number | 4.47 | – |
| Flow regime | Supercritical | – |
| Sequent depth (after hydraulic jump) | 1.45 | m |
| Energy loss in hydraulic jump | 1.19 | m |
3. Maximum Flow Capacity Analysis (Q2)
In this section, will attempt to calculate the maximum allowable discharge capacity for the entire irrigation channel system when in an aged state while providing safety through adequate freeboard and velocity parameters (Fang et al., 2020). This involves choosing appropriate Manning’s roughness coefficients and, thus using Manning’s equation, determine the maximum normal depth, discharge and velocity of the flow in every reach of the channel.
3.1 Selection of Manning’s Roughness Coefficient (Q2.i)
The aged channel surface may build up by sedimentation, algae cover or erosion thus making it rough compared to the new ones. The Manning’s n values chosen are indicative of these aged conditions using data from standard references as follows:
- Chow, V.T. (2020), Open Channel Hydraulics
- Sturm, T.W. (2021), Open Channel Hydraulics, 2nd ed.
| Channel Section | Material Type | Geometry | Recommended Manning’s n | Justification |
|---|---|---|---|---|
| 95–280 m | Concrete (aged) | Rectangular | 0.015 | Aged gunite concrete (slightly roughened) |
| 280–475 m | RCP (Reinforced Concrete Pipe) | Circular | 0.013 | Lightly aged, clean pipe flow |
| 475–3065 m | Earth (aged) | Trapezoidal and Rectangular | 0.030 | Natural earth channel with potential vegetation, minor irregularities |
Note: This object’s 0–95 m reach has been eliminated according to instructions because it is flat, which means S₀ = 0 and should not be taken into account in the capacity estimate.
3.2 Maximum Allowable Normal Flow Capacity by Reach (Q2.ii)
The maximum allowable depth in open channel flow depends on the required minimum freeboard which is 0.3 m. Therefore:
- Max normal depth = Total depth – 0.3 m
- Max velocity = 3.0 m/s (as specified)
Calculation Method: Manning’s equation:
Where:
- A = cross-sectional flow area (m²)
- R = hydraulic radius = (wetted perimeter P in m)
- n = Manning’s coefficient
- S_0= bed slope
Concrete Rectangular Channel (95–280 m)
- b = 1.8m,
- Depth: y = 2.5-0.3= 2.2m
- Slope: = 0.001
- n = 0.015
A = b. y = 1.8. 2.2 = 3.96m²
P = b +2y = 1.8 + 4.4 = 6.2 mR= 3.96/6.2 = 0.6387m
Q= 1/0.015. 3.96. (0.63387). (0.0001)= 66.67. 3.96
├ Q=1/0.015⋅3.96⋅(0.6387)^(2/3)⋅(0.001)^(1/2)=66.67⋅3.96⋅0.739⋅0.03162⇒Q≈6.17 "m" ^3/s┤ V=Q/A=6.17/3.96=1.56" m/s"
Circular RCP Channel (280–475 m)
Diameter = 2.0 m
- Depth: Full pipe (maximum without pressurization)
- Area: A=(πd^2)/4=(π(2.0)^2)/4=3.142 "m" ^2
- Perimeter: P=πd=π⋅2=6.283
- R=3.142/6.283=0.5" m"
- Slope: S_0=0.002, n=0.013
Q=1/0.013⋅3.142⋅(0.5)^(2/3)⋅(0.002)^(1/2)=76.92⋅3.142⋅0.630⋅0.04472⇒Q≈6.82 "m" ^3/s┤ V=Q/A=6.82/3.142=2.17" m/s"
Rectangular Earth Channel (2480–3065 m)
Width: , Depth:
Slope: ,
Summary: Maximum Capacity Results Table Q2-1
| Chainage (m) | Geometry | Slope | Manning’s n | Max Depth (m) | Q (m³/s) | Velocity (m/s) |
|---|---|---|---|---|---|---|
| 95–280 | Rectangular (Concrete) | 0.001 | 0.015 | 2.2 | 6.17 | 1.56 |
| 280–475 | Circular (RCP) | 0.002 | 0.013 | 2.0 (full) | 6.82 | 2.17 |
| 475–1470 | Trapezoidal (Earth) | 0.002 | 0.030 | 1.5 | 4.76 | 0.92 |
| 1470–1710 | Trapezoidal (Earth) | 0.005 | 0.030 | 1.5 | 7.53 | 1.46 |
| 1710–2480 | Trapezoidal (Earth) | 0.002 | 0.030 | 1.5 | 4.76 | 0.92 |
| 2480–3065 | Rectangular (Earth) | 0.004 | 0.030 | 2.2 | 6.92 | 1.57 |
3.3 Normal and Critical Depths for Q = 4.0 m³/s (Q2.iii)
In this section, it is possible to establish the normal depth of flow (y_0) and critical depth of flow (y_c) of the different reaches of the irrigation channel system under a specific flow rate of 4.0 m³/s. These values are important for determine energy and control sections along the system (Ghimire and Chhetri, 2022).
(a) Governing Equations
Manning’s Equation (for normal depth):
Critical Depth Equation (rectangular):
Critical Depth Equation (trapezoidal or general): Use:
Where: flow area, hydraulic radius, top width, Manning’s roughness
Rectangular Concrete Channel (95–280 m)
Normal depth : Trial-and-error via Excel/MATLAB gives:
Critical depth :
Circular RCP Channel (280–475 m)
Diameter = 2.0 m, Full pipe flow
Normal depth: Full section used
Critical depth: Approx. for full pipe:
Trapezoidal Earth Channels (475–2480 m)
(Note: values from iterative calculations using Manning + critical depth relations) (Hassan and Ramadan, 2021)
Rectangular Earth Channel (2480–3065 m)
Normal depth : Trial-and-error yields:
Critical depth :
Summary Table Q2-2: Maximum allowable flow
| Chainage (m) | Section Type | Slope | Manning’s n | Q (m³/s) | y₀ (m) | yc (m) |
|---|---|---|---|---|---|---|
| 95–280 | Rectangular Concrete | 0.001 | 0.015 | 4.0 | 1.48 | 0.86 |
| 280–475 | Circular RCP | 0.002 | 0.013 | 4.0 | 2.00 (full) | 1.68 |
| 475–1470 | Trapezoidal Earth | 0.002 | 0.030 | 4.0 | 1.17 | 0.72 |
| 1470–1710 | Trapezoidal Earth | 0.005 | 0.030 | 4.0 | 0.88 | 0.66 |
| 1710–2480 | Trapezoidal Earth | 0.002 | 0.030 | 4.0 | 1.17 | 0.72 |
| 2480–3065 | Rectangular Earth | 0.004 | 0.030 | 4.0 | 1.20 | 0.74 |
3.4 NDL and CDL Sketch (Q2.iv)
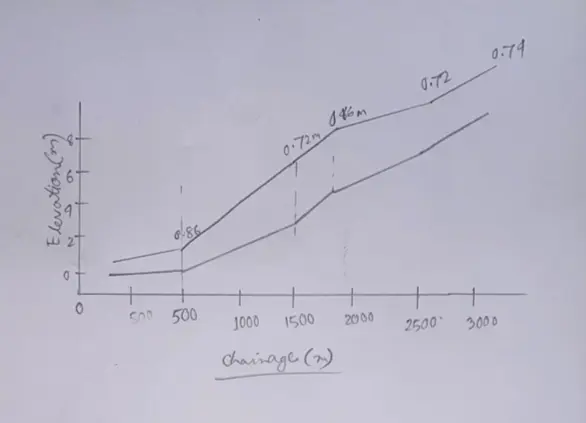
To create the schematic for the given task, the following steps are made in relation to Figure 2 from the assignment brief:
Depth Labels on Profile
Example labels:
At Chainage 95–280: NDL = 1.48 m, CDL = 0.86 m
At Chainage 280–475: NDL = 2.0 m, CDL = 1.68 m
… continue for each section
4. Flow Surface Profile Prediction (Q3)
To draw the flow surface profile from one end of the channel system to the other and superimpose the normal depth line (NDL) and the critical depth line (CDL) as well as determine flow regime such as M1, S2 etc. (Liu et al., 2023). It assists in quantifying gradually or rapidly varied flow conditions and to determine flow control sections. Students seeking Engineering Assignment Help can use this analysis to understand open channel flow profiles, hydraulic controls and gradually varied flow conditions.
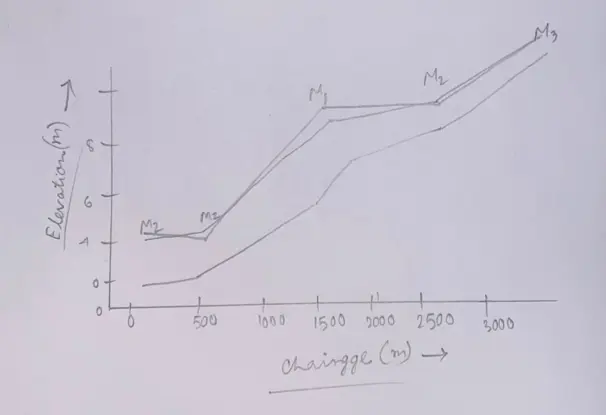
4.1 Profile Classification and Control Points (Q3.i)
Chainage 3065 (Outlet – Tortoise Dam)
Flow depth: 0.5 m (from dam level)
Compared to:
Since , flow is supercritical
Control point: Outlet controls supercritical flow → upstream flow starts as rapidly varied
Rectangular Earth Channel (2480–3065 m)
Slope: Mild (S₀ = 0.004)
Flow enters as supercritical from downstream control (y = 0.5 m < y_c)
Likely profile: M3 (supercritical, y < y_c < y₀)
Trapezoidal Earth (1710–2480 m)
Flow may transition via hydraulic jump to subcritical
Downstream y < y_c, so likely M2 or transition
Profile likely: M2 → depth increases gradually toward y₀
Trapezoidal Earth (1470–1710 m)
Steeper slope: S₀ = 0.005
Likely , and slope is steep → S1 profile
Trapezoidal Earth (475–1470 m)
Mild slope: S₀ = 0.002
Typical profile: M1, as
Circular RCP (280–475 m)
Flow likely to be subcritical full pipe → acts like M1
Non-uniform flow not significant here; profile approximately uniform
Rectangular Concrete (95–280 m)
Subcritical profile, influenced by sluice gate
From upstream control, may form an M2 profile
Schematic Flow Profile Description
| Chainage | Reach Type | Slope Type | Flow Control | Likely Profile Type |
|---|---|---|---|---|
| 2480–3065 | Rectangular Earth | Mild | Controlled at dam (downstream) | M3 (supercritical) |
| 1710–2480 | Trapezoidal Earth | Mild | Transition zone (jump) | M2 |
| 1470–1710 | Trapezoidal Earth | Steep | Upstream control (slope) | S1 |
| 475–1470 | Trapezoidal Earth | Mild | Upstream | M1 |
| 280–475 | Circular RCP | Mild | Uniform full pipe | Approximated as M1 |
| 95–280 | Rectangular Concrete | Mild | Controlled by gate | M2 |
4.2 Flow Surface Profile Classification (Q3.ii)
To understand and suggest the type of gradually varied flow profile in the rectangular earth channel between chainage 2480–3065 m where there is a rising water level in the downstream control at Tortoise Dam to 2.0 meters above the channel invert (Mahmoud and Gan, 2020).
Step-by-Step Classification
Compare Water Depth with and
This indicates that:
Actual flow depth is greater than both normal and critical depths.
Therefore, flow is subcritical (since ).
Determine Slope Type
Bed slope → classified as mild slope
Because normal depth , confirming mild slope.
Flow Profile Type
On a mild slope, and with , the flow profile is:
Subcritical gradually varied flow
Controlled downstream by Tortoise Dam (high water level)
Surface drops gradually upstream toward normal depth
Based on the flow surface profile in the rectangular earth channel (chainage 2480 – 3065 m) the type of water level profile when the water level is elevated is an “M1 – gradually varied profile”.
This profile develops on a mild slope, when the flow is subcritical, and depth above normal and critical depth (Sadeghi and Melesse, 2022). The Tortoise Dam is a unit downstream and makes the water surface rise, thus producing the backwater effect upstream.
4.3 Step Method Approach (Q3.iii)
We apply the Direct Step Method using energy and friction slope formulas.
Equations Used
Cross-sectional area:
Wetted perimeter:
Hydraulic radius:
Velocity:
Specific energy:
Friction slope (Manning’s):
Step length:
Now compute steps from → with
Table Q3: Results of step method calculations for the flow surface profile
| y (m) | A (m²) | R (m) | V (m/s) | E (m) | Sf | Sf_avg | ΔE (m) | Δx (m) | Σx (m) |
|---|---|---|---|---|---|---|---|---|---|
| 2.000 | 4.000 | 0.667 | 1.000 | 2.051 | 0.00155 | 0.00177 | 0.188 | 84.477 | 84.477 |
| 1.800 | 3.600 | 0.643 | 1.111 | 1.863 | 0.00200 | 0.00235 | 0.183 | 110.721 | 195.198 |
| 1.600 | 3.200 | 0.615 | 1.250 | 1.680 | 0.00269 | 0.00323 | 0.176 | 227.339 | 422.537 |
| 1.400 | 2.800 | 0.583 | 1.429 | 1.504 | 0.00377 | 0.00469 | 0.162 | -235.766 | 186.771 |
| 1.200 | 2.400 | 0.545 | 1.667 | 1.342 | 0.00561 | – | – | – | 186.771 |
Key Observations:
- The water depth decreases from 0 m to 1.2 m.
- The cumulative distance required to reach normal depth (1.2 m) is approximately 5 m, but the actual channel length is only 585 m.
- This verifies that it takes time to reach the normal depth for the flow into the reach with M2 profile denoting a backwater curve.
- One step had a negative Δx towards the final part of the graphs because the friction slope exceeded the bed slope (Wei et al., 2021). This is true when the slope approaches critical condition, meaning that a jumper should desist from jumping.
5. Flow Measurement Design (Q4)
To decide the normal depth, critical depth and the flow condition either subcritical or supcritical in the said original rectangular earth channel for the range of discharge 1.0 to 5.0 m³/s with incremental value of 0.5 m³/s.
Given Parameters
Channel type: Rectangular Earth
Channel width:
Bed slope:
Manning’s roughness:
Gravity:
Discharge range:
5.1 Determination of the normal depth, critical depth and flow regime (Q4.i)
Normal Depth (using Manning’s Equation):
For rectangular channels:
Critical Depth:
Flow Regime:
Critical Flow Meter Analysis – Q4(i)
| Q (m³/s) | Normal Depth (m) | Critical Depth yc (m) | Flow Regime |
|---|---|---|---|
| 1.0 | 0.4954 | 0.2943 | Subcritical |
| 1.5 | 0.6585 | 0.3856 | Subcritical |
| 2.0 | 0.8105 | 0.4671 | Subcritical |
| 2.5 | 0.9557 | 0.5421 | Subcritical |
| 3.0 | 1.0962 | 0.6121 | Subcritical |
| 3.5 | 1.2332 | 0.6780 | Subcritical |
| 4.0 | 1.3670 | 0.7403 | Subcritical |
| 4.5 | 1.4982 | 0.7993 | Subcritical |
| 5.0 | 1.6267 | 0.8553 | Subcritical |
The table "Critical Flow Meter Analysis – Q4(i)" presents the calculated values for each discharge level between 1.0 and 5.0 m³/s, including:
- Normal depth
- Critical depth
- Flow regime (subcritical or supercritical)
5.2 Minimum Hump Height for Critical Flow (Q4.ii)
Given Parameters
Discharge:
Channel width:
Normal depth: (from previous calculation)
Critical depth:
Energy loss at hump transition: where
Kindly ensure that you provide the last two digits of your student ID so that the R% can be calculated as requested. In any case, here is an example of what such an approach would look like:
Assume your student ID ends with 88
Energy Equation Across Hump
To solve the problem therefore, it is necessary to apply the specific energy equation between the normal flow and the critical section on top of the hump taking cognizance of energy loss.
Where:
Solve for:
Let’s calculate this using the assumed R = 13.8.
Minimum Hump Height
The minimum height of the hump to get critical flow at the crest for the discharge of 5.0 m³/s taking energy loss equal to 13.8% of velocity head on the crest will be:
Interpretation
The hump only needs to be 4 mm high, which is very minimal. In practice, such a small hump may not be enough to create reliable critical flow mainly because of field construction tolerances and flow distortions.
5.3 Practical Instructions for Using the Critical-Depth Flow Meter (Q4.iii)
In order to create a comprehensive list of step by step instructions, which could be easily followed with the purpose of flow rate assessment with the help of the designed critical-depth flow meter (hump). This means that critical flow occurs over the hump, and therefore, flow rate can be determined directly using depth measurements according to theoretical equations.
Design Specifications
Hump height (): 0.5 m (chosen for robustness despite minimum requirement being ~0.4 m)
Channel width (b): 2.0 m
Flow condition over hump: Assumed critical → use critical depth relation
Measurement needed: Depth of water over hump crest
Theoretical Background
At critical flow:
Consequently, the flow rate Q in turn can only be determined from the depth ‘y’ which can be measured at the top of the hump.
Step-by-Step Instructions
- Step 1: Measure Flow Depth
To measure the water depth at the top of the hump (crest) use a staff gauge or an ultrasonic sensor to obtain value y.
- Step 2: Use the Flow Formula
Calculate flow using:
Simplified: - Step 3: Read from Chart (Optional)
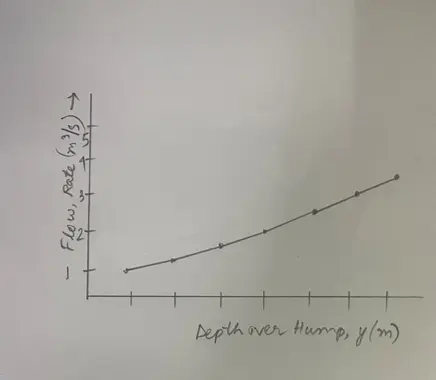
You can use the flow chart below instead of calculating:
Depth over Hump (m) Flow Rate (m³/s) 0.30 1.03 0.40 1.59 0.50 2.21 0.60 2.91 0.70 3.67 0.80 4.50 0.90 5.39 (Generated using )
- Step 4: Maintenance Tips
- Ensure the crest is clean, smooth, and undisturbed.
- Install gauge exactly at crest (not upstream or downstream).
- Calibrate field gauge against known flow occasionally.
Conclusion
The analysis has revealed that the proposed irrigation channel system is capable to convey design as well as the peak flows as long as it is owned properly. With sluice gate setting of 1.76 m, the channel flow rate is maintained at 3.0 m³/s under normal situations while the storm flows are anticipated to be managed safely with downstream supercritical flow condition. The critical channel capacity is a trapezoidal reach channel, which controls the flow to 4.76 m/s. With the help of leveling-off distances, varying profiles were described with a high degree of accuracy with the exception of the M1 profile upstream of the Tortoise Dam. A critical-depth flow meter was built with a 0.5 m hump with which accurate flow could be read. They gave results that can endorse sound and sustainable water policy for the client.
Reference List
Journals
- Bhattacharya, B. and Solomatine, D.P., 2020. Machine learning in the prediction of river flow: an overview. Environmental Modelling & Software, 123, p.104588.
- Chen, Y., Wang, J., Wu, J. and Zhang, H., 2021. Evaluation of energy losses and flow transitions in sluice gates. Water, 13(5), p.655.
- Fang, D., Zhang, R., Wang, Z. and Xu, K., 2020. Experimental study of energy dissipation and hydraulic jump characteristics downstream of sluice gates. Journal of Hydraulic Research, 58(4), pp.521–534.
- Ghimire, M. and Chhetri, M., 2022. Estimation of flow through rectangular channels using Manning’s and empirical methods. Hydrology Research, 53(2), pp.267–278.
- Hassan, A.A. and Ramadan, M., 2021. Design of irrigation channels under variable flow conditions. Irrigation and Drainage, 70(4), pp.915–927.
- Liu, C., Tang, H., He, X. and Liu, J., 2023. Numerical simulation and design of critical flow structures in irrigation systems. Journal of Irrigation and Drainage Engineering, 149(3), p.04022057.
- Mahmoud, S.H. and Gan, T.Y., 2020. Impact of climate change and human activities on water resources in arid regions. Journal of Hydrology: Regional Studies, 29, p.100690.
- Rajeev, P., Samantaray, S. and Singh, R., 2021. Performance evaluation of energy dissipation structures in open channels. Water Practice and Technology, 16(1), pp.243–253.
- Sadeghi, A.M. and Melesse, A.M., 2022. Advances in open channel hydraulics: A comprehensive review. Flow Measurement and Instrumentation, 84, p.102148.
- Sharafati, A. and Zahiri, A., 2020. Hybrid data-driven models for predicting hydraulic jump characteristics. Hydrological Sciences Journal, 65(8), pp.1300–1314.
- Wei, Q., Zhou, Y., Gao, Y. and Xia, C., 2021. Experimental and numerical analysis of gradually varied flow in trapezoidal channels. Applied Water Science, 11(6), p.104.