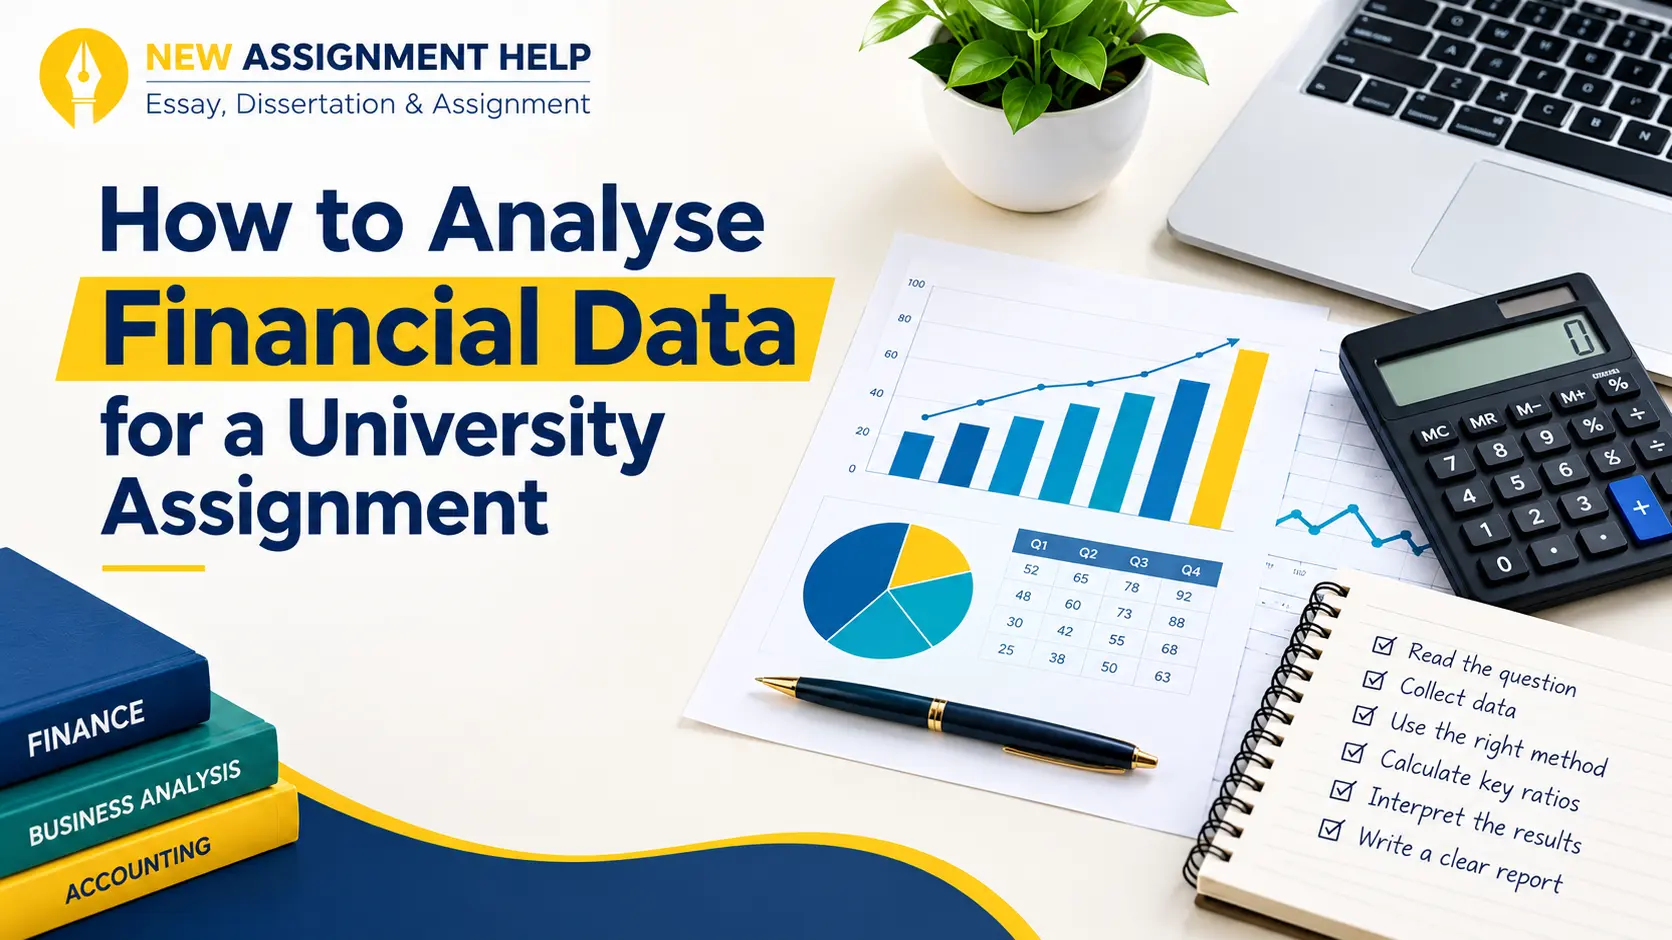
When all you have are pages full of numbers and a rubric that asks for “critical analysis”, financial data looks scary. Many students at Australian universities feel stuck at this point and look for a clear process on how to analyse financial data for their assignments. When you have a simple structure, the task becomes much easier. This guide is written for exactly that purpose. Here you will see how to analyse financial data one step at a time, from reading the question to writing your findings. So, let’s begin.
Take a Thorough Reading of the Question
Read the task twice and keep underlining the command words, such as evaluate, compare or assess. These words show how deep your analysis needs to go. Next, note the company, the time period and the expected output. Some tasks ask for a three-year review of one firm while others want a comparison with a rival or an industry average.
On a clearer look, you will also find that your unit guide has listed the data sources and software too. Check it before you open any files. This step will help you keep your work focused. Once you know it, you can start collecting the right numbers.
Collect Reliable Data and Choose the Right Method
If you do not know where to begin collecting your data, start from your annual reports. You can easily find them on ASX-listed companies’ investor pages. Your university library may also give access to databases such as Bloomberg or FactSet. Try to aim for at least three years of figures and make sure that all numbers use the same units and reporting dates. Save each source as you go, because you will need it for referencing later.
When you have your data ready, it’s time that you choose the right method to analyse it. Below are the most common methods to analyse financial data for a uni assignment, where each method answers a different kind of question. Learn this and you’re halfway through.
| Method | What it shows | Best used when |
|---|---|---|
| Horizontal (trend) analysis | Change in each item over several years | You want to track growth or decline |
| Vertical (common-size) analysis | Each item as a percentage of a base figure | You compare firms of different sizes |
| Ratio analysis | Links between different figures | You judge profit, risk or efficiency |
| DuPont analysis | The parts that drive return on equity | You explain why returns moved |
Most assignments need only two or three of these. Trend and ratio analysis together cover most undergraduate tasks. Moving on, ratios deserve a closer look, so that is next.
Work Through the Key Ratios
Ratios fall into four main groups. Pick a few from each group instead of listing every formula you know.
- Profitability: net profit margin, return on assets and return on equity.
- Liquidity: current ratio and quick ratio.
- Solvency: debt to equity and interest cover.
- Efficiency: asset turnover and inventory days.
A balanced set gives you a full view of the firm. Still, a ratio says little until you explain it. That brings us to the next step of building your workings.
Build Your Financial Steps in Excel
Set up one sheet with years across the top and line items down the side. Use formulas so every figure updates when you fix a mistake. Keep your raw data on a separate tab and add a simple chart for each major trend.
Every chart suits a specific reasoning. For example, if you wish to show changes over time, use a line chart. Whereas if you want to show comparisons between firms, use bar charts. Moving on, some units use R or Python for regression and time series work. Follow whichever tool your unit guide names. Label every chart and table clearly, since markers skim these first. Your workings are only half the job, your analysis makes sense only when you interpret your results.
Interpret What Your Financial Numbers Mean
This is where most marks are won or lost. Compare each result with either the last year, a rival or the industry average. Then explain the reason behind the change. A fall in profit margin might link to higher costs, a price cut or a one-off expense. Check the notes to the accounts and the directors’ report for clues. Here you can also use a simple pattern like:
- State what happened.
- Explain why it happened.
- Say what it means for the business.
After this, do not forget to mention the limits. Firms use different accounting policies, and one-off items can distort a single year. Pointing this out shows critical thinking, something that your marker expects from you. Once your points are clear, you can now finally shape them into a report.
Wrapping It Up
Good analysis follows a clear path. Read the question, gather clean data, pick suitable methods, calculate and explain every result through a proper layout: introduction, method, findings, discussion and conclusion. Keep your sentences short and direct. Define any ratio, reference your data sources using APA 7th or Harvard and check every number twice before you submit. This is the easiest way to analyse your financial data for your upcoming assignment. If you want a second opinion on your structure or interpretation, finance writing support from a reliable service can do wonders for you. At last, note that each step builds on the last, so skipping one usually shows in the final mark.