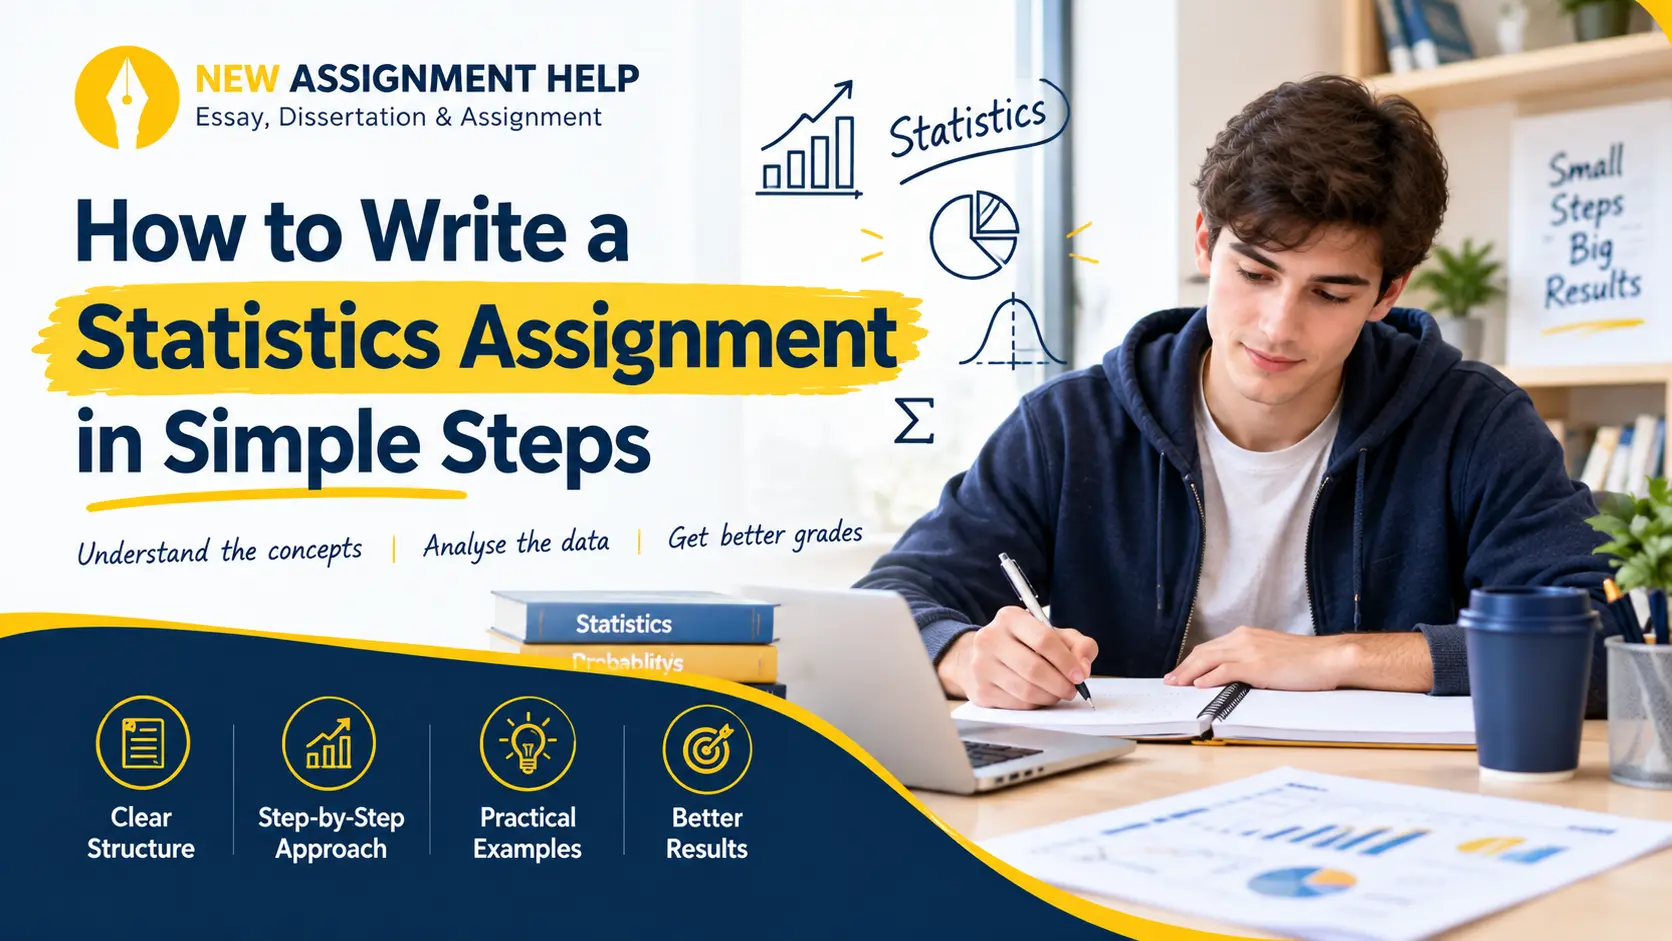
Ever felt the dilemma where you have data, maths, and tools but still searching for how to write a statistics assignment? That's exactly what we are going to learn in this guide. It all starts by breaking the task into 7 clear steps and picking one at a time. So, let’s not waste time and get straight into it.
Step 1: Read the Brief Properly
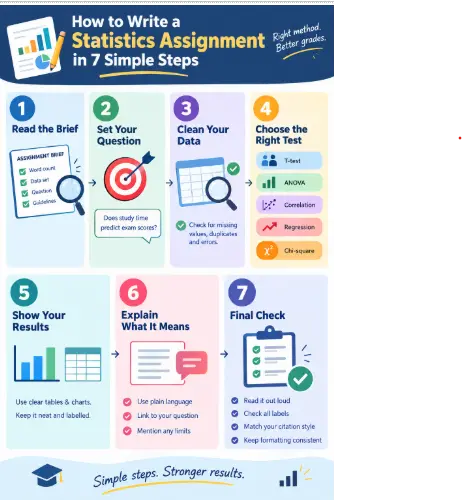
Before you open any software, read your assignment brief twice. Note the word count, the data set you need to use, and the exact question you must answer. Many students lose marks simply because they misread or do not get what’s been asked. If you’re also confused about a term or the outline, it’s better to ask your tutor early. This small step saves hours later, because it shapes every choice you make after this point. Like turning it into the right topic.
Step 2: Narrow Down Your Statistics Topic and Question
Once you understand the brief, turn it into one clear research question. A good question is specific and testable. For example, instead of "study exam results", you can frame it like, "Does study time predict exam scores in first-year students?" This kind of question is answerable and points you towards the right test later. Try to keep your question short enough to fit in one line so that it’s easy to understand and cover. With your question set, you can move on to gathering the data that will answer it.
Step 3: Collect and Sort Your Data
Since data is the backbone of the whole assignment, do not skip this section. Whether you are given a data set or asked to collect your own, check it closely before you start any analysis. Look for missing values, duplicate entries, or obvious typing errors. The benefit of having clean data is that it gives you a result you can trust. This part of the work may not sound very exciting, but it protects you from mistakes in every later section.
Step 4: Choose the Right Statistical Method
Below is a list of 6 common methods and their uses for you to choose for your upcoming statistics assignment.
- Independent-samples t-test: This one is used to compare the means of two independent groups.
- Paired-samples t-test: Here you compare measurements from the same participants under two conditions or at two time points.
- ANOVA: It tests whether there is evidence that at least one group mean differs, under the relevant assumptions.
- Correlation: This is used to check if two numeric variables move together, like hours studied and grades achieved.
- Regression: When you need to predict one variable using other variables, you use this test.
- Chi-square test: Checks the relationship between two categorical variables, such as gender and course choice.
Each of these tools answers a different kind of question, so matching the right one to your data avoids wasted effort. Once you know which test fits, you can run it in software such as SPSS, R, or Excel and move to writing up what you find.
Step 5: Present Your Numerical Results Clearly
The next step is to turn your output into a clean table or a simple chart and label every axis and column. One thing to be aware of here is consistent formatting. This needs to be done right, as markers can easily catch sloppy layout and this often affects your marks. The simplest way to do this is by rounding your figures to a sensible number of decimal places. Next, put your findings in a clear table to let your reader see the pattern before you even explain it in words.
Step 6: Explain What the Numbers Mean
This step is usually the last one, so many students rush this and eventually lose marks. But if you learn the trick here, you may never hit the same wall again. What you have to do is:
- After each result, add one or two sentences that explain what it means in plain language.
- Avoid just repeating the number back.
- Say what it suggests about your original question, and mention any limits in your data or method.
Here also comes the structuring of statistics assignment.A well-organised report usually follows a 4-step structure that makes it easy for your marker to follow. If you need a more detailed overview of the subject, explore our Statistics Assignment writing service for further guidance on organising and presenting your work.
- Introduction: This is where you state your topic and your hypothesis
- Methodology: Explain your research design, your data source, and the test you used
- Statistical Analysis: Here you share your results using charts and short explanations
- Conclusion and Recommendations: Answer your original question and the limit we talked about
This structure keeps your report clear and easy to grade. Once your draft is written, the only step left is the final check.
Step 7: Final Check
- Read your report out loud to catch awkward sentences.
- Check that every chart and table has a label.
- Make sure your citations match your unit's required style, like APA or Harvard.
- Keep your decimal places consistent throughout the paper.
- Keep formatting clean, consistent and professional.
This final check often makes the difference between an average grade and a strong one.
Conclusion
When you approach your statistics assignment in this way, you’ll realise how easy it is to write one. All you have to do is start with the brief, build your question, clean your data, pick the right test, and explain your results in plain words and you’re good to go!

 9 Years | Ph.D. in Statistics