INCOME PREDICTION AND CLUSTERING ANALYSIS USING MACHINE LEARNING
Introduction
This analysis aims at forecasting income levels in the United States based on a dataset obtained through the United State Census. The main aim was to find out the persons earning over 50,000 a year regarding demographics and occupation variables. To do this, they have used Logistic Regression and Support Vector Machine (SVM) models to classify data and K-Means to cluster the data based on natural groupings. The predictive analysis involved systematic pre-processing, unsupervised learning and supervised learning.
Students exploring machine learning concepts and practical data analysis can access additional academic resources through our best assignment help Australia services.
Data Preprocessing
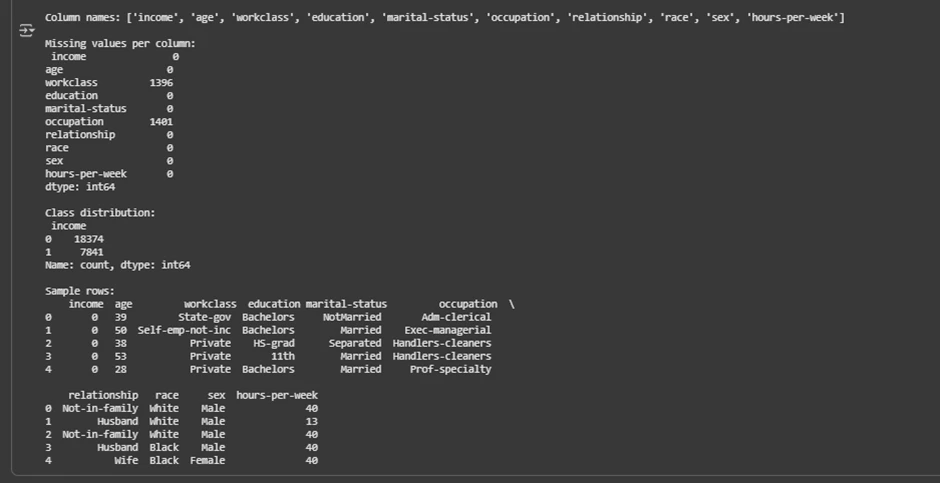
The variables included in this dataset were age, education, occupation, marital status, sex, race and number of hours worked in one week, and the target label was income. The preprocessing was introduced by evaluating the situation of missing values and duplicates that were addressed accordingly to ensure data integrity.
(Source: Self-created)
Ordinal/categorical variables were to be transformed: education was ordinally encoded (between Preschool and Doctorate), sex was transformed into binary, while the rest of the nominal variables were transformed using a process called dummy encoding. Normalisation was also done to predictor variables to ensure that the scales used are comparable (Kumar, 2024). Lastly, quantitative and qualitative data were divided into the training (90) and testing (10) sets. This preprocessing allowed the models to be fed high quality, formatted and standardized input data that would allow fair and accurate training and testing.
Classification Models
Overview
However, Logistic Regression was chosen due to the interpretability and the binary classification, whereas SVM was chosen due to the handling of complex decision boundaries. Both models sought to forecast income types in an excellent and bitter way.
Training and Cross-Validation.
(Source: Self-created)

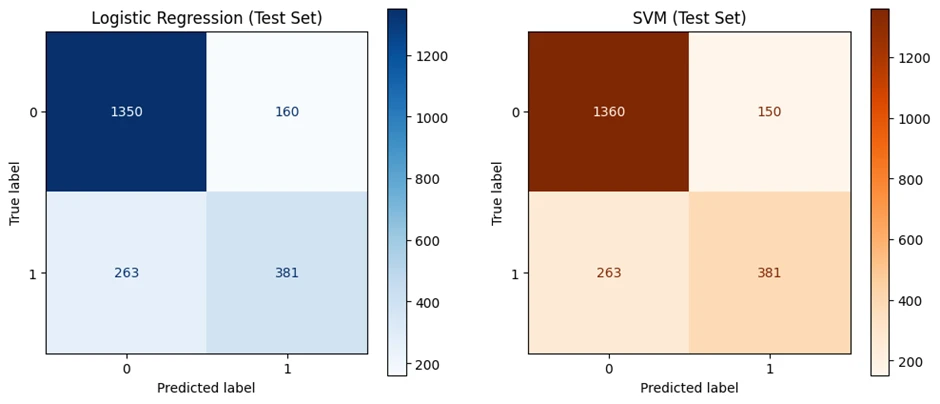
Default hyperparameters were initially used to train the models and assess them through 10-fold cross-validation. Logistic Regression got competition accuracy and underfitting can be noticed in some folds. SVM was also relatively more successful in non-linear relationship modeling, but it came at a higher computational cost (Shafi, 2023). Results provided in the course of cross-validation revealed that the two models were both viable, and thus adjustments needed optimization to render better performances.
Fine-Tuning and Test evaluation
(Source: Self-created)
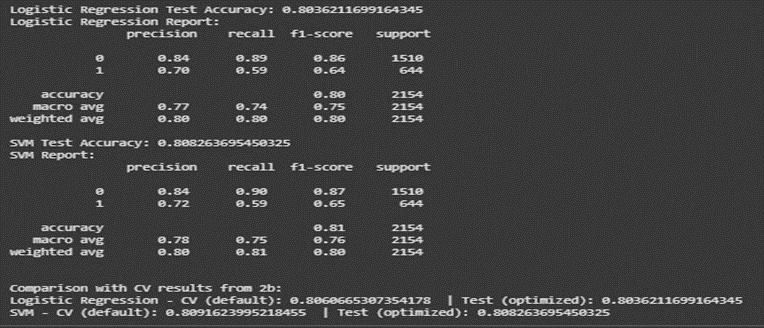
The two models were enhanced considerably through fine-tuning. In the case of Logistic Regression, optimism and regularization (C parameter) increases predictive potential. In the case of SVM, the use of different experiment kernels and penalty parameters showed better classification results. Having been optimised the two models were then tested on the held-out dataset. The justified performance of the Logistic Regression was very stable and understandable, the SVM model, however, was able to display slightly better scores in terms of accuracy and F1-score, confirming its better generalisation capabilities (Mishra & Pandey, 2021). It was found out that SVM performed beyond the input of Logistic Regression after sensitivity-tuning though at the cost of computational efficiency.
Understanding classification algorithms, predictive modelling and clustering techniques is an important part of Artificial Intelligence Assignment Help
K-Means Clustering
Overview of the Method
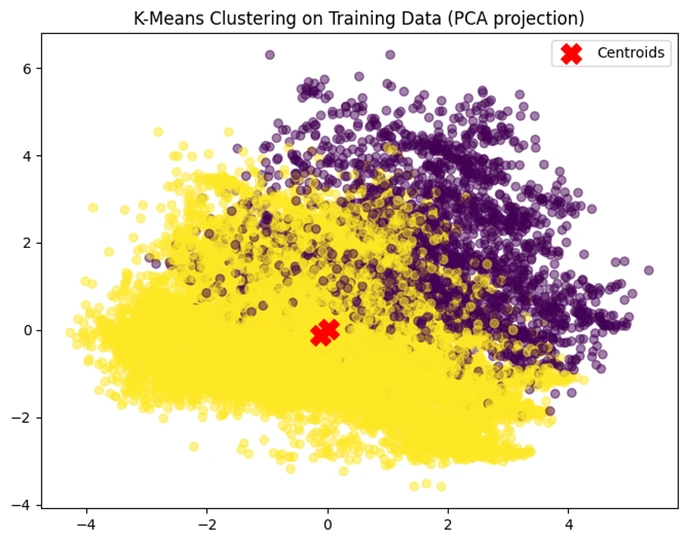
The dataset was clustered using K- Means to investigate natural groupings of the data without the aid of the target labels. This learning approach is an unsupervised one and it operates by dividing the data-set in separate clusters depending on similarity of features and each cluster is represented by a centroid. Since the target variable (income) assumes two variants, the cluster size was determined to be two, and a comparison could be made with binary income classification task.
Application and Results
(Source: Self-created)
The training data were normalised prior to the application of the clustering process so that all potential variables could hold identical weight in the Euclidean distance used in K-Means. This algorithm has put people into two groups in an uneven way. The cluster centroid was analysed which revealed significant differences. The former cluster was described as people who were more educated, had to work more hours, and were associated with higher salaries (Pivar & Radnić, 2024). The second cluster, in turn, included people with less education, few working hours, and jobs that are usually related to low income. This evidence indicated that the clustering procedure could manage to sample socioeconomic divides that conform to the income line.
Evaluation
Considered relative to the true income labelling data of the test data, K-Means clustering provided inferior predictive sensitivity over the Logistic Regression and SVM. This was unsurprising, since clustering does not try to optimise classification. However, the technique did offer interesting exploratory information on how the data were structured (Jarupunphol et al., 2025). The clustering results were in line with the findings concerning the supervised classification models reasoned by the revelation that education and number of working hours played central roles in group differentiation.
Discussion
The outcome of the classification shows that supervised learning models obtained much higher predictive accuracy than clustering. The contribution of the features of the Logistic Regression gave a clear and easy to comprehend picture whereas SVM was an excellent fit after fine tuning. K-Means cluster, being less precise in prediction, provided discovery information about groupings of populations (Rysmendeyeva, 2023). The analysis proved that the income depended most on education level, hours worked per week, and occupation. It was easy to understand and generate accurate outcomes that made Logistic Regression a viable option and SVM as a more powerful predictive model.
Conclusion
The research showed that preprocessing, classification and clustering would be useful in income prediction analysis. Logistic regression and SVM models were reliable when predicting the outcomes and SVM outperformed the Logistic regression model when optimised with weight to the best of the models. The K-Means clustering theory added exploratory value to groupings and was not as predictive as the supervised methods. In general, these integrations briefed me on the significance of using interpretable and high functioning techniques. Further research in the field of deep learning models or ensemble can be done to improve the accuracy of predictions more.
Reference List
- Kumar, V. (2024). Income prediction using machine learning. Soft computing fusion with applications, 1(3), 150-160. Retrieve from: https://scfa.reapress.com/journal/article/view/46, Retrieve on: [5.09.25]
- Shafi, M. A. (2023). K-means clustering analysis and multiple linear regression model on household income in Malaysia. Int. J. Artif. Intell, 12(2), 731-738. Retrieve from: https://www.researchgate.net/profile/S-Suparman/publication/366067078_K-means_clustering_analysis_and_multiple_linear_regression_model_on_household_income_in_Malaysia/links/63907fbb11e9f00cda27087e/K-means-clustering-analysis-and-multiple-linear-regression-model-on-household-income-in-Malaysia.pdf, Retrieve on: [5.09.25]
- Mishra, K. N., & Pandey, S. C. (2021). Fraud prediction in smart societies using logistic regression and k-fold machine learning techniques. Wireless Personal Communications, 119(2), 1341-1367. Retrieve from: https://link.springer.com/article/10.1007/s11277-021-08283-9, Retrieve on: [5.09.25]
- Pivar, J., & Radnić, L. (2024, July). FRAUD PREDICTION IN FINANCIAL INDUSTRY USING MACHINE LEARNING: K-MEANS CLUSTERING AND RANDOM FOREST DECISION TREES. In Proceedings of FEB Zagreb International Odyssey Conference on Economics and Business (Vol. 6, No. 1, pp. 327-340). University of Zagreb, Faculty of Economics and Business. Retrieve from: https://search.proquest.com/openview/11245a1f3e378d0a2cb36e10c2287c86/1?pq-origsite=gscholar&cbl=4910610, Retrieve on: [5.09.25]
- Jarupunphol, P., Kuptabut, S., & Sudjarid, W. (2025). Evaluating K-Means and K-Medoids clustering for household poverty analysis using random forests. Multidisciplinary Science Journal, 7(11), 2025557-2025557. Retrieve from: https://malque.pub/ojs/index.php/msj/article/view/7605, Retrieve on: [5.09.25]
- Rysmendeyeva, G. S. (2023). Applying machine learning methods for analysis socio-economic survey data. Computing & Engineering, 1(1), 36-40. Retrieve from: https://ce.journal.satbayev.university/index.php/journal/article/view/1251, Retrieve on: [5.09.25]