Quantitative Analysis Report on
Firm Size and Firm Value: Empirical Analysis based on S&P 500 Data (2010-2020)
1. Research Question and Hypothesis
1.1 Research Problem
This correlation between the size of firms and the value of firms has been a major issue in the study of corporate finance and accounting. The economies of scale linked with market power and stability are linked to firm size which is normally measured in terms of natural logarithm of total assets (Goh et al., 2022). On the other hand, firm value, which is commonly represented by market-to-book ratio (MKTBK), is the opinion of the stock market about the growth prospects of the firm in comparison with the book value of equity (Kim, 2023). The knowledge of the high and/or low valuation multiples of big firms is important since it is the basis of discussions on efficiency, risk, and market perceptions.
1.2 Background
Previous studies give contradictory findings. In the study by Noumir et al. (2023), a size effect is found, in which smaller firms receive higher risk-adjusted returns, suggesting that the market takes into account the growth prospects of large firms. Conversely, Goh et al. (2022) propose that the bigger a firm, the better the governance structure, hence, creating a more stable valuation. The disagreement points out that size of the firm can determine the value either in terms of risk taking and risk giving or in terms of investor perceptions.
Tobin Q, which is a measure of market value in comparison with the replacement cost, is also widely captured in market-to-book ratios (Kim, 2023). When this ratio is high, the investors anticipate companies to produce growth other than the book value of their assets. When a positive correlation exists between firm size and value, then this implies that markets are rewarding stability and size. Should this be negative, it implies that markets prefer agility and expansion.
1.3 Hypotheses
Based on the above, the hypotheses are:
Null Hypothesis (H0): The size of the firm and the value of the firm are not correlated.
Alternative Hypothesis (H1): The size of the firm and the value of the firm are significantly correlated.
Students looking for academic guidance on finance and quantitative research topics can explore resources through our best assignment help Australia platform
2. Research Methods and Sample
2.1 Research Method
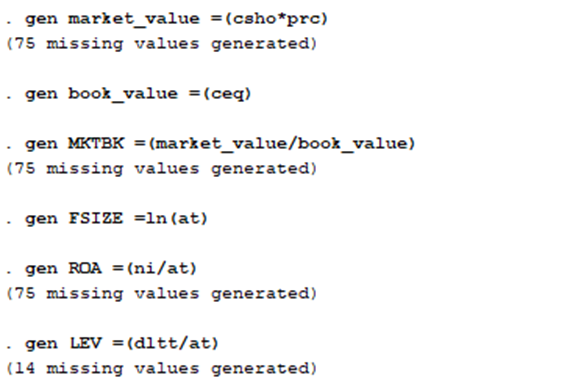
This research employs quantitative research, with reference to the use of secondary data based on the results of S&P 500 companies between 2010 and 2020. The market-to-book ratio (MKTBK) used as a proxy of firm value is market value of equity (shares outstanding x end year price)/book value of equity (common equity) (Kim, 2023). The size of firms is in the form of natural logarithm of total assets (FSIZE = ln(AT)) (Pila et al., 2022). Control variables are ROA (profitability = net income / total assets), LEV (leverage = long-term debt / total assets) and the age of the firm (number of years old).

It is analysed in three stages, which include descriptive statistics and distribution tests, univariate analysis (t-test and rank-sum test), and bi- and multivariate analysis (correlation, regression). An ordinary least squares (OLS) regression is used since the dependent variable (MKTBK) is continuous (Osborne, 2016).
2.2 Descriptive Statistics
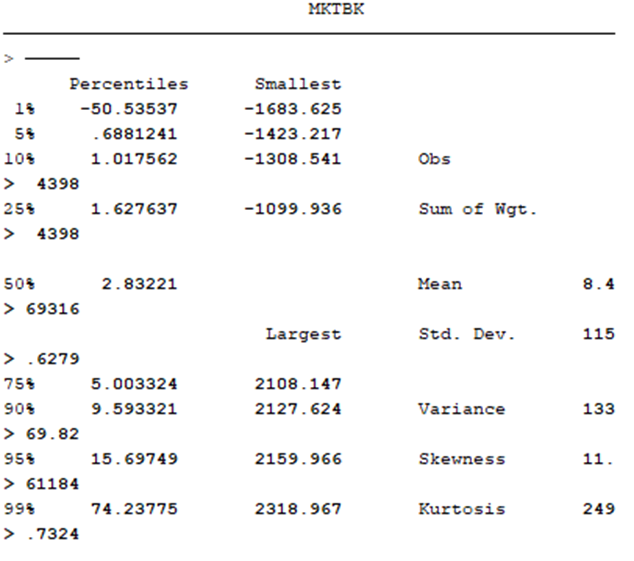
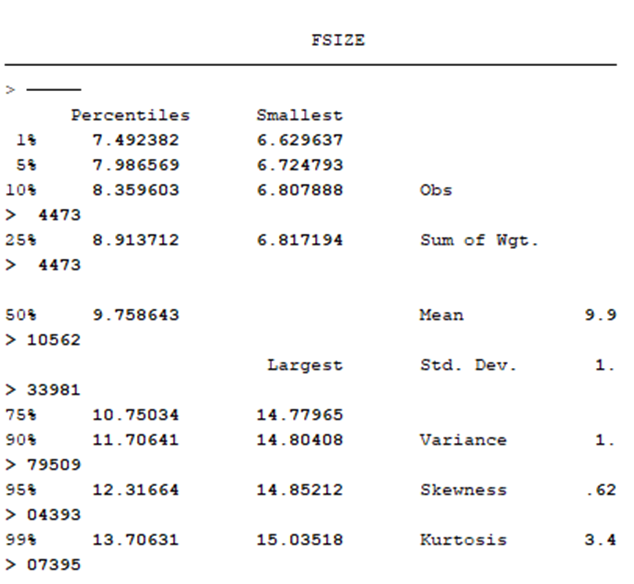
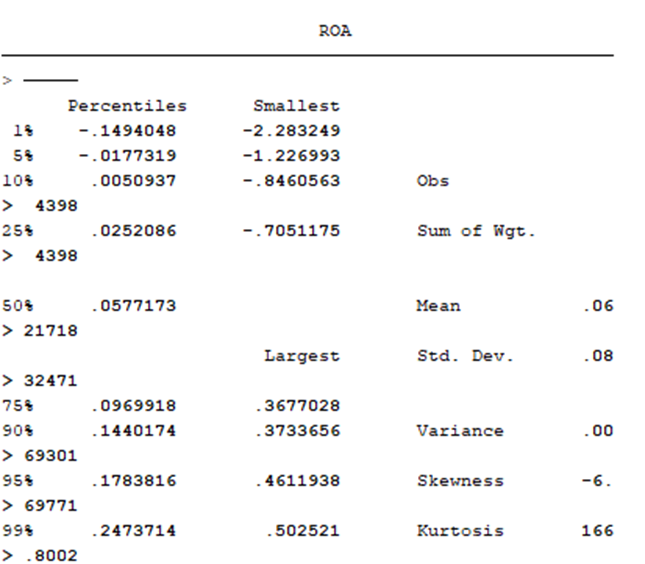
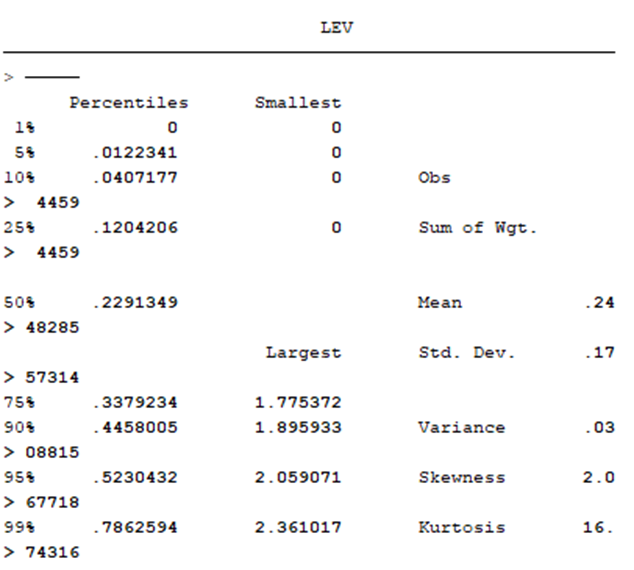
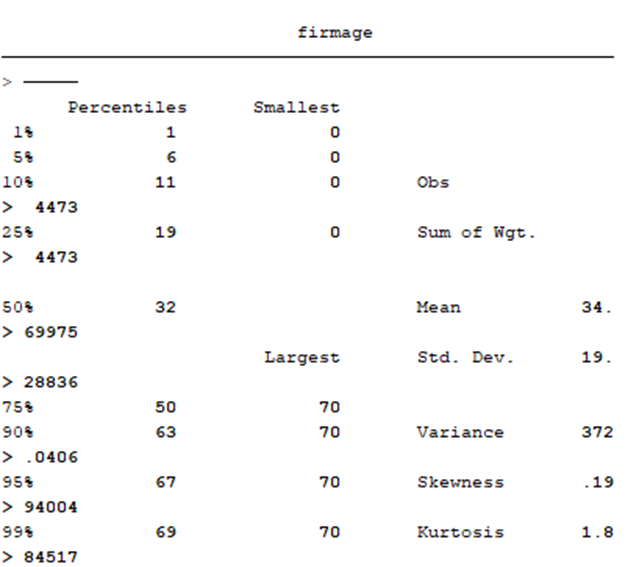
The skewness and kurtosis of MKTBK are extreme, with certain firms having unrealistically high valuations, meaning they have outliers (e.g. high growth tech companies) (Hatem et al., 2022). FSIZE has a normal skew and is slightly skewed with slight kurtosis. The frequency of ROA is a negative skewed curve with heavy tails since there are firms that incurred huge losses. The skewness of LEV is right-oriented; the majority of firms have moderate leverage, whereas some of them have an abnormally high debt. The Age of the Firm is skewed towards both directions. This discussion indicates that MKTBK and ROA might require some trimming or winsorizing to be made robust, but the regression is estimated to use robust errors in order to address any distributional concerns.
Understanding financial ratios, firm valuation and regression-based analysis is also an important part of Finance Assignment Help
3. Univariate Analysis
The market-to-book ratio (MKTBK) serves as the proxy of the dependent variable of the study, that is, firm value. The most important independent variable is the size of the firm (FSIZE) which is measured as the natural logarithm of total assets. In order to investigate whether small and large firms have different values of the firm, the sample is first separated into two categories based on the median value of FSIZE (1 - large, 0 - small).. Firms with a median exceeding the median were termed as large firms and those with the median that was lower than small firms.

3.1 Two-Sample t-Test
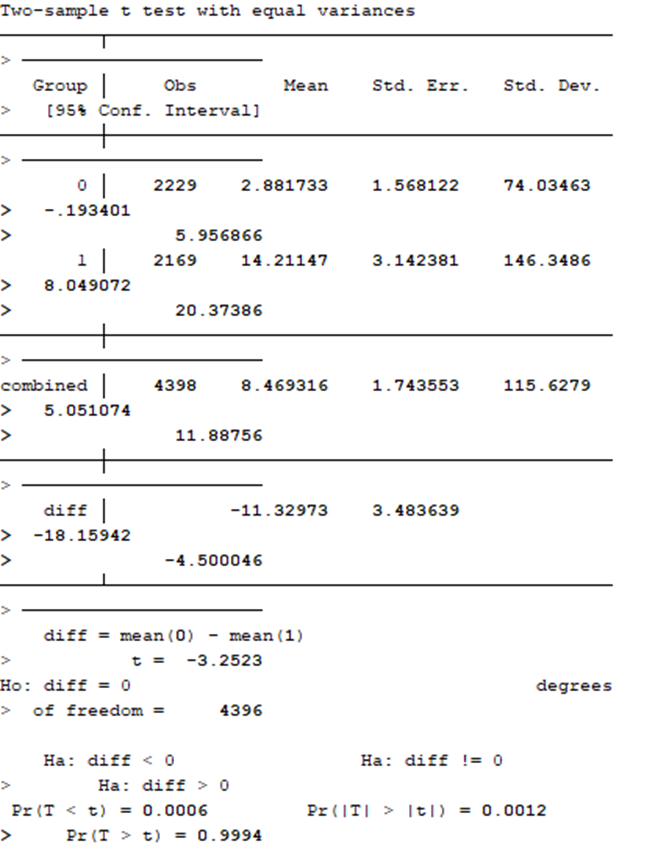
Findings show that smaller companies (n=2229) have an average MKTBK of 2.88 whereas the average MKTBK of larger firms (n = 2169) is much higher, at 14.21 (Kelter, 2021). The average value of the difference is -11.33 which is statistically significant (t = -3.25, p < 0.01). This fact indicates that the bigger companies are likely to be linked to much higher valuation multiples compared with their smaller counterparts.
It is noteworthy, though, that the huge standard deviations (74.03 in the case of small firms and 146.35 in the case of large firms) indicate extreme variability in MKTBK, which is in line with the descriptive statistics. The mean difference is therefore statistically significant though it must be used with caution due to the presence of outliers.
3.2 Nonparametric Rank-Sum Test
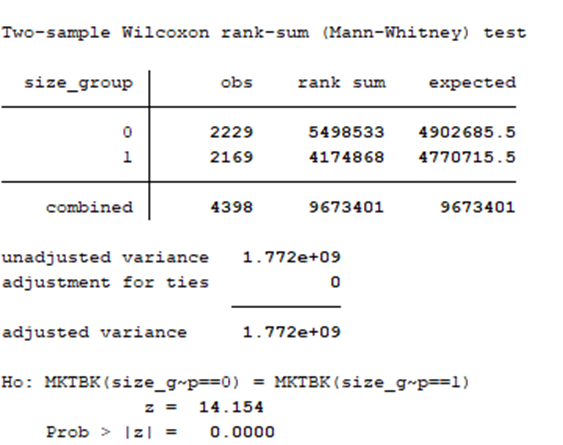
MKTBK is highly skewed, and it has outliers, so a nonparametric Wilcoxon rank-sum test was used. The test is used to compare the general distribution of firm value of the two size groups (Kelter, 2021). The findings are a very strong rejection of the null hypothesis of equality (z = 14.15, p < 0.001). This means that the differences in the firm value between the large and small firms are not just caused by extreme values but are strong throughout the entire distribution.
3.3 Interpretation
Combined, the t-test and rank-sum test point in the same direction and gives convincing evidence of the correlation between firm size and firm value. On average larger firms have much higher market-to-book ratios, and this implies that investors place greater valuations on larger firms. This confirms the hypothesis B (H0) and shows that the magnitude of a firm is significant in influencing the perception of value of a firm in the market.
4. Multivariate Analysis
4.1 Model Selection
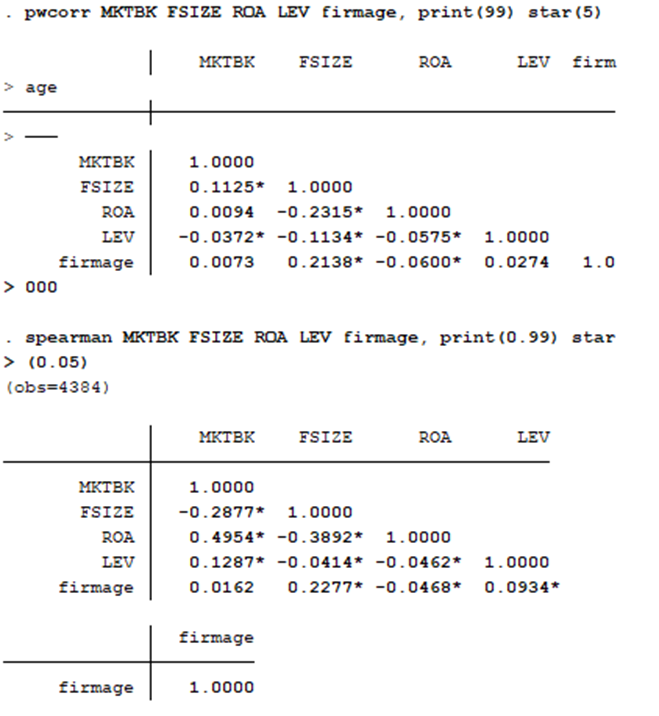
In order to check further the competition between firm size and firm value after taking into account other factors which are important, OLS regression was estimated. The reason why OLS is appropriate is that the dependent variable (MKTBK) is continuous. Although MKTBK is heavily skewed, strong standard errors were applied in order to counteract the effect of non-normality. It could not be a logit or probit model as the dependent variable is not binary.
There were three control variables included:
- Profitability (ROA = NI/AT): More profitable firms tend to have higher valuation multiples as they have better earnings potential.
- Leverage (LEV = DLTT/AT): Investors can punish the firms with more debt levels because of the increased risks of being in a state of financial distress.
- Firm Age: Older firms can be considered more stable and less growth oriented, which affects valuation differently than is applied to younger firms.
The equation of the regression model consequently becomes the following:
MKTBKi=β0 + β1*FSIZEi + β2*ROAi + β3*LEVi + β4*FirmAgei + εi
4.2 Regression Results
-
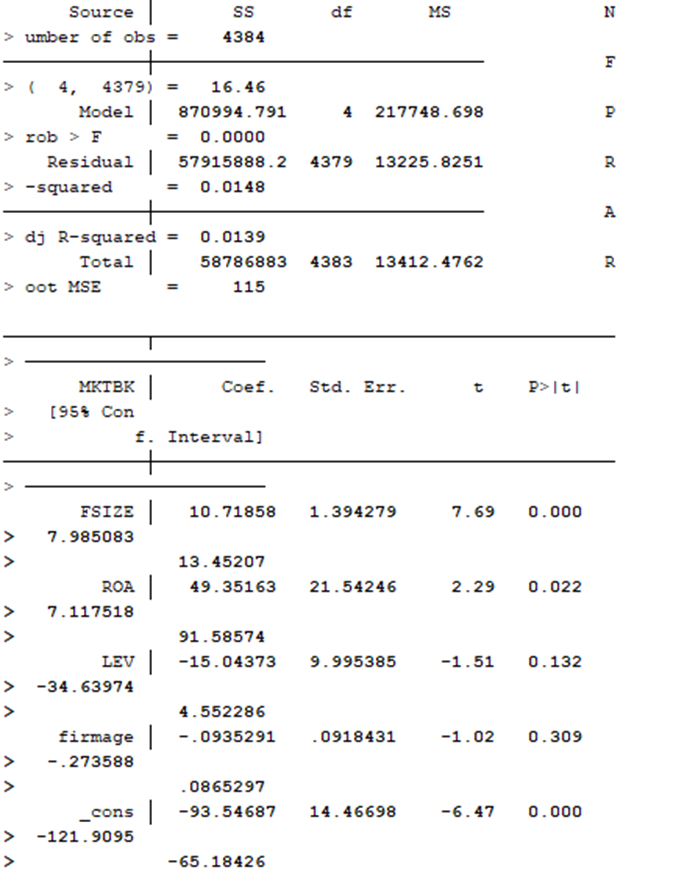
Firm Size (FSIZE): Coefficient = 10.72, p = 0.001. This significant and favorable correlation indicates that bigger companies are priced more significantly by markets, other factors remaining the same.
-
Profitability (ROA): Coefficient = 49.35, p = 0.022. As is expected in theory, profitability alone is found to be positively and significantly related to firm value.
- Leverage (LEV): Coefficient = –15.04, p = 0.132. The negative relationship is not statistically significant, though, suggesting that leverage does not have a strong impact on valuation in this sample.
- Firm Age: Coefficient = –0.09, p = 0.309. Minor, implying that the age of a firm is not an important factor in valuation when other variables are held constant.
- Model Fit: The regression accounts for only 1.5 percent of firm value (R-square = 0.0148). Although the general F-test shows that the variables are statistically significant (p < 0.001) the low R-square suggests that firm value is being driven by several other variables not contained in the model, including industry, growth potentials, and market sentiment.
Conclusion
This research paper explored the correlation between the firm size and firm value in the case of S&P 500 firms (2010-2020). Univariate tests (t-test and rank-sum) performed using market-to-book ratio as firm value and log of total assets firm size showed significant differences between the two groups (larger firms were highly valued). Regression analysis showed that firm size and firm value had a strong positive relationship even after accounting profitability, leverage, and firm age. Profitability was also important, whereas leverage and age did not matter. In general, the results reject the null hypothesis and indicate that the markets favour the scale of firms and their profitability in explaining the valuation.
Reference List
- Goh, T. S., Henry, H., Erika, E., and Albert, A., 2022. Sales growth and firm size impact on firm value with ROA as a moderating variable. MIX: Jurnal Ilmiah Manajemen, 12(1), 99-116.
- Hatem, G., Zeidan, J., Goossens, M. and Moreira, C., 2022. Normality testing methods and the importance of skewness and kurtosis in statistical analysis. BAU Journal-Science and Technology, 3(2), p.7.
- Kelter, R., 2021. Bayesian and frequentist testing for differences between two groups with parametric and nonparametric two‐sample tests. Wiley Interdisciplinary Reviews: Computational Statistics, 13(6), p.e1523.
- Kim, D., 2023. Market-to-book ratio in stochastic portfolio theory. Finance and Stochastics, 27(2), pp.401-434.
- Noumir, A.M., Langemeier, M.R. and Mallory, M.L., 2023. Risk-adjusted farm returns and farm size. Agricultural Finance Review, 83(3), pp.528-547.
- Osborne, J.W., 2016. Regression & linear modeling: Best practices and modern methods. Sage Publications. (Book)
- Pila, J., Muturi, W. and Olweny, T., 2022. Moderating Effect of Firm Size on Financial Uncertainty Indicators and Financial Performance of Manufacturing Firms in Kenya. Journal of Accounting and Finance in Emerging Economies, 8(4), pp.489-500.