The most useful statistics assignment structure is a mix of numbers, charts, and written analysis all in one document. Many Australian university students lose marks because of their messy and rushed structure. But when you use a clear format, your work automatically becomes easy to follow. This also shows your lecturer that you actually understand the full research process. So if you have an assignment on your desk but are not sure how to structure it? Do not worry. This guide will break the structure down into standard sections. You’ll end up with a quick checklist to save in your draft and worked examples of what to include in each part.
The Essential Sections of a Statistics Assignment
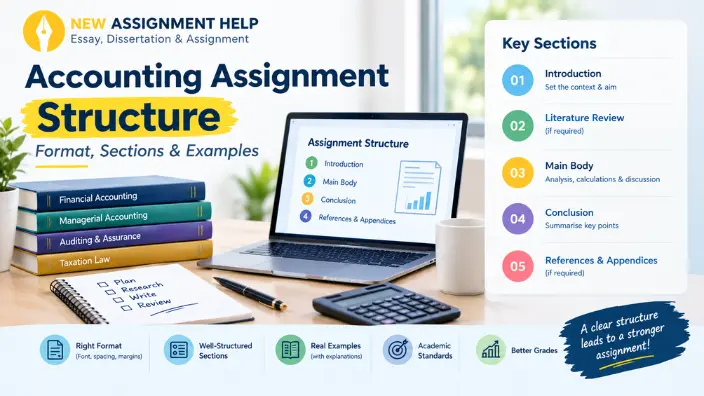
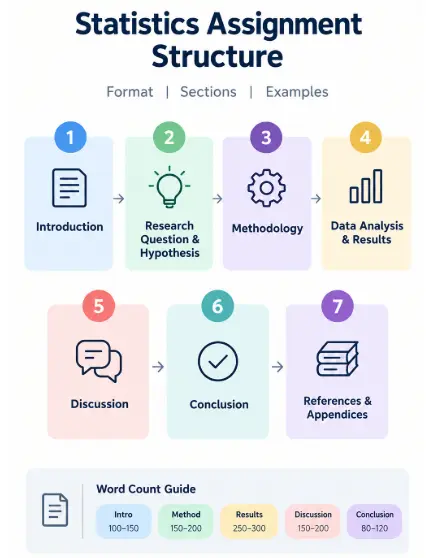
When writing a statistics assignment, the below structure is the most acceptable one:
- Introduction
- Research question and hypothesis
- Methodology
- Data Analysis and Results
- Discussion
- Conclusion
- References and appendices, if required
Note: Connect your question, data, method, findings, and conclusion logically.
The Introduction Section
Your introduction is all about setting the scene. It should briefly explain your statistics assignment topic, its relevance and the purpose. Try to state your aim in one or two sentences with a focused research question at the end.
One important thing here is to keep this section short. Most introductions run between 100 and 150 words, which includes your question and the hypothesis. Avoid jumping into calculations here because that is going to come in the later sections.
Research Question and Hypothesis
Here you need to identify the variables or groups you want to study. Also mention the type of data you are working with, whether it's survey results or a sample dataset.
“What affects student performance?” is a vague research question. But if you try, “Is weekly study time associated with exam scores among first-year university students?” then it becomes a much more focused question to analyse.
If required, state your hypotheses like:
H₁: There is a statistically significant association between weekly study time and exam scores.
The key here is to match your wording with your method and research design.
Methodology
This section explains how you collected and prepared your data. Here, you need to state your sample size, your data source, and any tools you used, be it Excel, SPSS, or R. If you applied a specific test, like a t-test or chi-square test, name it here and explain why you chose it.
Try to keep this section factual. Write it like a set of instructions someone else could follow to repeat your study. This builds trust in your results before you even present them.
Data Analysis and Results
This is the core of your assignment. Here, you present your findings using tables, graphs, or summary statistics. A results section usually includes:
- Descriptive statistics, such as mean, median and standard deviation
- Visual tools like bar charts, histograms or scatter plots
- Output from any statistical test you ran, such as a p-value
Each table or chart needs a short introduction and a short explanation afterwards. Do not just insert a graph and move on. Tell your reader what it shows and why it matters for your question. Once your results are laid out clearly, you can move into discussing what they actually mean for your original question.
Discussion
This section is where you connect your results back to your research question. Here you explain whether your findings support or challenge your initial expectations. You can also compare your results with what other studies or your course readings suggest. If there are any limitations, mention those as well. Maybe your sample size was small, or your data had missing values. Naming these honestly shows strong academic judgement. After discussing what your results mean, you are ready to wrap everything up.
Conclusion
Now the only thing left is to summarise your key findings in a few sentences, and you’re good to go. Restate your aim and confirm whether your analysis answered it. Avoid introducing new data or arguments here. This section is about closing the loop so keep it that way. Note: a strong conclusion must leave your reader with a clear sense of what you found and why it matters.
References and Appendices
After your statistics assignment is done, follow the required referencing style, whether that is APA, Harvard or any other and reference every claim accordingly. Appendices can contain supporting material such as survey questions, detailed calculations, or supplementary statistical output.
With the structure sorted out, let’s see how many words should be credited to each section. This is where most Australian students struggle.
A Quick Section Layout
While you’re wondering how to write a statistics assignment, you must keep in mind the word count and the purpose of each section. This will stop you from overdoing or underdoing the efforts.
| Section | Approx. Word Count | Purpose |
|---|---|---|
| Introduction | 100–150 | State the aim and context |
| Methodology | 150–200 | Explain data and methods used |
| Results | 250–300 | Present findings with visuals |
| Discussion | 150–200 | Interpret and compare results |
| Conclusion | 80–120 | Summarise key points |
This table here will give you a rough idea about how to tackle each section of a statistics assignment at an Australian university level. Always double-check the word count limit specified by your unit outline.
Final Thoughts
A strong statistics assignment follows a logical path: question, data, method, results, interpretation, and conclusion. The goal is to show a clear connection between what you investigated, how you analysed the data, what you found, and what those findings mean.
Once you get comfortable with these five sections, writing future statistics assignments becomes far less stressful. Focus on clarity in every section, and your analysis will speak for itself. If you need professional assistance with your coursework, explore our do my statistics assignment service for support with data analysis, structure, and presentation.

 10 Years | Ph.D. in Mathematical Statistics