Picking a statistical test can feel confusing at first because all you have is some data and no direction to start. However, the good news is that this choice follows a clear pattern once you know what to look for. In this guide today, we’ll break down the process into simple steps so you know how to pick the right statistical test for your upcoming assignment. If you’re also working on the overall writing process, see our guide on how to write a statistics assignment. Let’s tackle this one step at a time.
Start With Your Research Question
Every statistical test begins with a clear question. Ask yourself what you actually want to know. Are you comparing two groups? Are you looking for a link between two things? Are you trying to predict an outcome? Your answer here shapes everything that follows.
For example:
- If you want to know whether two teaching methods lead to different exam scores, you are comparing groups.
- If you want to know whether study hours relate to grades, you are looking for a relationship.
For more ideas, explore our statistics assignment topics before finalising your research question.
Basically, all you have to do is write your question down in plain words before you touch any numbers. This one step can give you so much clarity about which test to choose. Now that your question is clear, the next thing to check is what kind of data you actually have.
Look at Your Variable Types
Research question isn’t enough. It is your data type that decides which tests are even possible. Variables usually fall into two broad groups. Categorical variables and numerical variables. The first one tackles things like gender, course type, or yes-and-no answers. The latter one analyses things like test scores, age, or income.
Some tests only work with categorical data while others only work with numbers. But there are a few tests that handle both. Knowing this early stops you from picking a test that simply cannot use your data.
Take a moment to list your variables and label each one. Once you know what type of data sits in front of you, you can move on to the shape of the comparison you want to make.
Match Your Comparison to a Test Family
Most assignments fall into one of the three comparison types.
- Comparing between different or the same groups
- Looking at a relationship between two variables
- Checking an association between categories
If you are comparing the average score of two groups, a t-test usually fits.
If you have three or more groups, an ANOVA test is the standard choice.
If both your variables are categorical, a chi-square test checks whether they are linked.
If you want to see how two numerical variables move together, correlation or regression works well.
This matching step is often where students get stuck, so a quick reference table sets things straight.
| Situation | Statistical Test to Apply |
|---|---|
| Comparing 2 group | Independent t-test |
| Comparing 3+ group | One-way ANOVA |
| Same group, before and after | Paired t-test |
| Link between two categories | Chi-square test |
| Link between two numbers | Correlation or regression |
This table is just the starting point. Always consider the data at hand to get a full picture of which test to apply to your assignment.
Check Your Data Assumptions
Every test comes with a few ground rules. These are called assumptions, and skipping this check is one of the most common mistakes students make.
Parametric tests, like the t-test and ANOVA, usually assume your data follows a normal distribution. They also often assume equal spread across groups. You can check these assumptions with a histogram or a formal test like Shapiro-Wilk.
If your data breaks these rules, do not panic. Non-parametric tests exist for exactly this reason. A Mann-Whitney test can replace a t-test. A Kruskal-Wallis test can replace an ANOVA.
These options are useful when your sample is small or your data looks skewed rather than normal. Checking assumptions takes a few extra minutes, but it protects the quality of your final result. So, make it a habit to include it in your assignment-building steps.
Think About How Your Data Was Collected
The structure of your data also matters. Ask whether your groups are independent or connected in some way. Independent groups usually involve separate people or separate samples, such as two different classes sitting the same test. Paired or repeated data involves the same group measured twice, such as scores before and after a study session.
Using the wrong structure for your test can weaken your results or lead to an incorrect conclusion. A paired t-test, for instance, only works when each score in one group has a direct match in the other. Once you have confirmed this detail, you are almost ready to run your analysis.
Bring It All Together
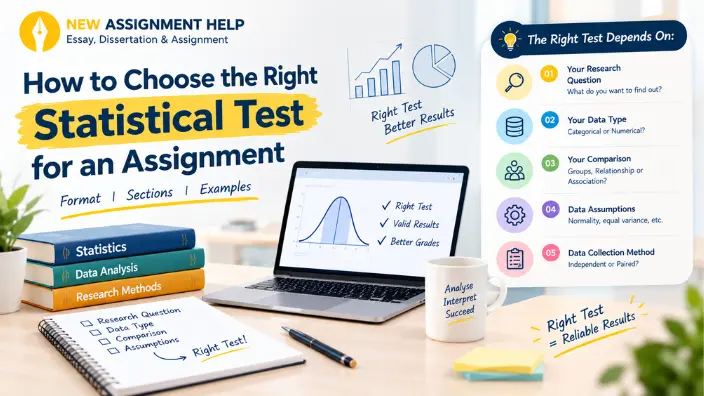
Choosing the right statistical test comes down to four questions.
- What is your research question?
- What type of data do you have?
- What comparison are you making?
- Does your data meet the test assumptions?
Once you have selected the right test, presenting your analysis clearly is just as important. See our statistics assignment structure guide for the key sections to include.
When you start working through these four questions step by step, you get a clear path to the correct test almost every time. With a bit of practice, this process becomes just as easy to handle without any extra stress. You’ll learn to choose the right test automatically by just looking at the research question. If you need further guidance with your statistics assignment, expert support can help you work through data analysis and test selection with greater confidence.

 12 Years | Master of Applied Statistics