Do you know that you can run a test in SPSS or R and still stare at the output, unsure what it means? Yes, you heard it right. This happens to most Australian students when they do not know how to interpret statistical results properly. However, we’ve got you some good news today. This interpretation can be made easy once you start following a clear pattern. Well, if you haven’t chosen your statistical topic yet, our guide on how to choose the right statistical test for an assignment covers that step first. From there, we’ll cover the basics, the common traps, and how to turn raw output into a strong written interpretation in detail. So, let’s get started.
Begin with your descriptive statistics
Before you touch a p-value, look at your descriptive statistics first. These are the numbers that describe your data set as a whole. It will have:
- Mean: the average score in your data
- Median: the middle value when scores are lined up in order
- Standard deviation: how spread out the scores are
- Sample size (N): how many people or cases you tested
Read these numbers together to get the fuller picture. A high mean with a huge standard deviation tells a different story than a high mean with a small one. Once you understand what your sample actually looks like, the inferential tests start making a lot more sense.
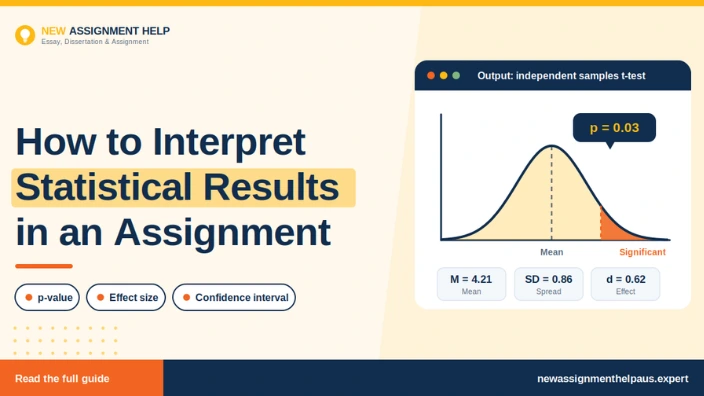
Try to understand what your p-value is telling you
Here you have to make sure that even if there was no effect or no difference in the population, your result stays the same as now. Most university courses use a cutoff of 0.05. If your p-value sits at or below that number, your result is called statistically significant. If it sits above 0.05, you fail to reject the null hypothesis.
The p-value is often the part that trips students up. It gets treated like a single pass or fail mark, but it means something more specific than that. A small p-value does not prove your idea is correct. It gives you the assurance that the pattern in your data is actually workable and not random. Once you get your p-value correct, note the distinction down because markers often check for it directly.
After this, the next question is how much that result actually matters.
Look up the effect size
A result can be statistically significant and still be small in real terms. This is where effect size comes in. It measures the actual size of a difference or relationship, separate from whether it passed the significance test. A large study can turn a tiny, unimportant difference into a significant result, simply because the sample size is big. Effect size stops you from overstating a finding like this.
Confidence intervals work alongside effect size.A 95% confidence interval gives a range of plausible values for the population parameter based on your sample and method. A narrow interval suggests a more precise estimate. A wide one suggests your data has more uncertainty than a single number can show. Together, effect size and confidence intervals give a fuller picture than a p-value alone. They move your interpretation from a simple yes or no into something closer to how strong and how precise the finding actually is.
Check the limitations before you conclude anything
Every data set has limits, and a strong statistics assignment is the one that actually names them instead of hiding them. For each section, there is something; let’s have a look.
- Sample size: small samples make it harder to detect real effects and easier to get unstable results
- Sampling method: a sample that does not represent the wider population can skew your findings
- Confounding variables: outside factors that influence your results without being part of your test
- Assumptions: many tests assume things like normal distribution, and violating this changes the results no matter how trustworthy the output is
Now that you have this checklist, always go through this before you write your conclusion. Naming a limitation does not weaken your work. It shows your marker that you understand the data rather than just running a test and reporting whatever number appeared. With the limitations noted, it’s now time to put the whole interpretation into words.
Put it all together in plain language
Now that you have everything you need to interpret your statistical results in your assignment, let’s put them all together.
- Connect your statistics back to your original research question.
- State the test you used, the key statistic, and the p-value.
- Then explain what that result means for your hypothesis, using plain language.
- Mention the effect size if you calculated one.
- Note any limitation that could affect how far your conclusion reaches.
- Avoid claiming that your result proves anything with total certainty.
Since statistics deal in probability, claiming something will only make your marker furious. A careful, measured conclusion reads as more credible than a bold, overstated one. If you want to see exactly where this interpretation should sit within your report, our blog on the best statistics assignment structure will walk you through it with examples.
Once you interpret your results using these steps, your statistical output will automatically stop giving you a hard time. It will start feeling like a set of numbers with a clear story attached, and that story is exactly what your assignment is asking you to tell. So, try this today and ace your next statistical assignment. In case you get stuck at any step here, you can seek expert guidance through our statistics assignment services and get support with analysis and interpretation.

 10 Years | Ph.D. in Mathematical Statistics